What is QScope?
QScope.org is an advanced online log analyser application providing statistics and charts with innovative features for HAM Radio operators.
While designed with amateur radio contesters score improvements in mind, it can help any HAM to have a better visibility over its logbook.
QScope offers complementary features to services like Logbook of the World or Clublog.
You can import ADIF or Cabrillo logs and have various statistics like QSOs per band, mode, operator; QSOs Rate; Operating Time...
How to use it?
First go to the following page, register, and you will soon received a confirmation e-mail. Then, login in to QScope you can upload and import your logs to the database, and run statistics or draw charts.
QScope was first created to provide a simple but comprehensive statistics tools for casual contesters. Registration and usage are free for those users.
After the 30 days trial period, seasoned contesters or dxpeditionner may find that a free account does not fullfil their needs. A yearly donation of at least $5 will allow them to enjoy an unrestricted account.
See the details about accounts types and donations to check what kind of account matches your needs.
Current QScope version 2.24.1 offers informations and features such as*:
- Number of QSOs, duplicate QSOs (Dupes), Operating Time
- Number of unique callsigns worked, unique DXCCs entities, CQ and ITU Zones
- Average and Maximum QSO Rates over periods of 10, 30 and 60 minutes
- List of stations worked, with bands and modes worked, number of slots (band/mode combination) and number of dupe QSOs
- Activity Map showing for each operator which band, mode, operating position was more productive during a contest (hourly) or a DXpedition (daily)
- Band Changes charts showing how much band changes you commit and how long you stayed on each band before changing
- Bands/Modes tables showing for each band/mode the number of QSOs and unique calls, number of DXCCs and number of stations having worked you several times, number of stations per number of dupes
- DXCC first worked listed by chronological order
- Charts with number of Top stations per QSOs numbers, QSO numbers per bands, modes, continents or operators
- Charts with number of Top stations and Top DXCCs per Duplicate QSOs numbers, Duplicate QSO numbers per bands, modes, continents or operators
- Charts with number of Points per unique callsign, band, mode or operator
- Charts with number of QSOs per CQ and ITU Zones
- Charts with number of QSOs per DXCC entities and Grid Squares (Locators), number of DXCCs and Locators per band and mode
- Charts showing hour by hour (contest) or day by day (DXpedition), the Number of QSOs and Points, Number of new CQ and new ITU Zones worked, Number of new DXCC entities and new Prefixes worked, Number of new DXCC entities and new Grid Squares worked
- Charts with Operating Time per band, mode or operator with parameter for pause duration
- Charts listing Pauses for every operator and radio/operating position with parameter for pause duration
- Charts showing minute by minute how much was your QSO Rate for your whole log, per operator or per band, with parameter for the sample duration from 5 minutes to 60 minutes
- Charts with Maximum QSO Rates per band, mode or operator with parameter for the sample duration from 1 minute to 60 minutes
- Charts with Average QSO Rates based on real operating time per band, mode or operator with parameter for the pause duration from 1 minute to 60 minutes
- Integration with Google Maps and Google Earth trough KML/KMZ files to draw geographical maps of the DXCC or Locators your worked, Log Replay (Time Lapse style) of your QSOs
- Charts with number of QSOs per Distances and Azimuths (bearing) ranges
- Log reprocessing to modify modes, bands or update DXCC/Continent/Zone with latest Country-File informations
- Log management features to copy containers, clean Duples, filter the logs content by band, mode, operator and continent
- Fast log search with wildcards
- Public log search that users can manually enable for one specific container and display selected charts publicly
- Log export in ADIF v3 format
- Results export in Text format, CSV format (for spreadsheet import) and Graphical charts (when applicable)
- PDF File generation from the text or charts results
- PDF File generation packaging all the already generated charts for a given container
- Ability to select different colour sets for charts
Acknowledgements:
QScope is based on several Public Domain or Free Software software components and credits should be given to the authors of:
- Debian/Linux, Apache and Postgresql
- PHP, Jelix and pChart
- Jim AD1C Country-Files (CTY.DAT) informations
Many beta-testers for the COSTA Project and QScope users have given valuable comments and suggestions. I cannot list here every contribution with the risk of forgetting some. Any contribution is important as even the small bug detected can lead to a vastly improved application.
Thanks again!
Hosting:
QScope website is hosted in France in an OVH datacentre. One VPS server runs the web front-end and the database server with a state-of-the-art architecture. It has daily backup and hourly snapshots ensuring high reliability and recovery time. OVH provides a secured network with anti-DDOS mechanisms. The servers are regularly updated and are installed with the best security practices.
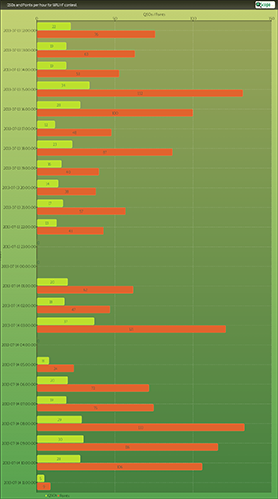
Time chart example:
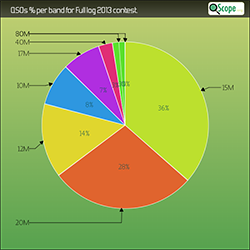
QSOs per band example: